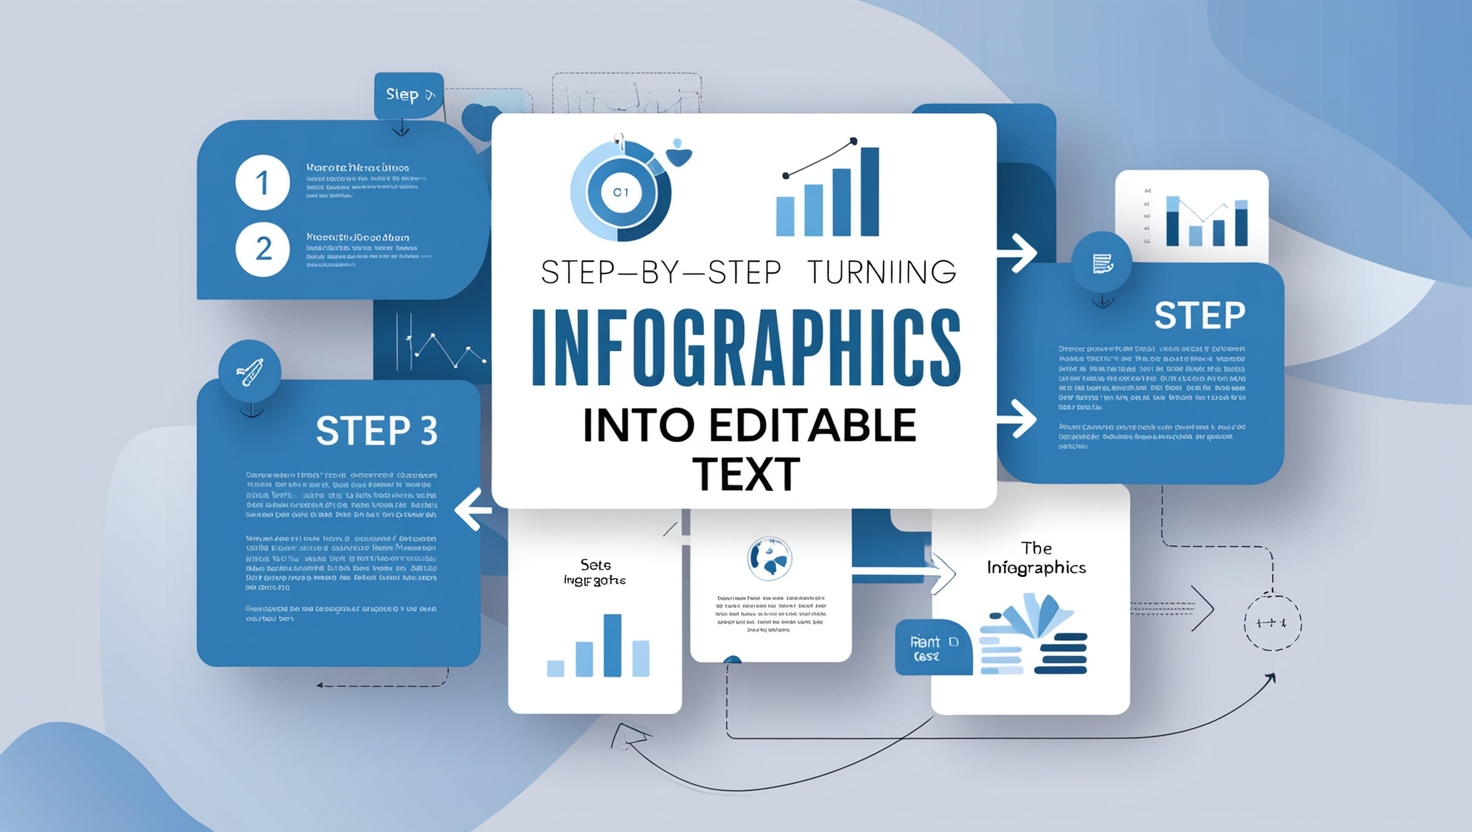
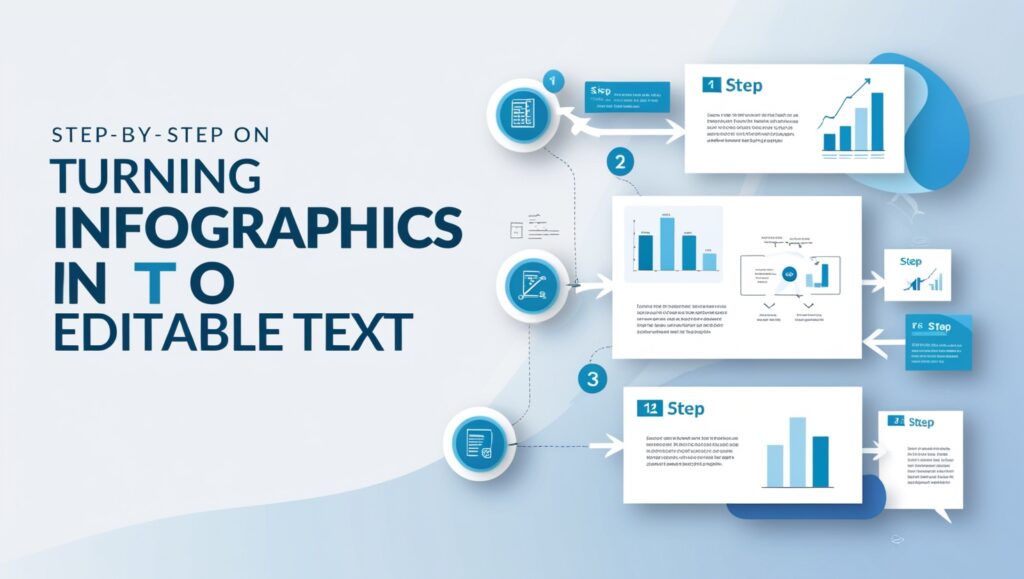
Turning Infographics into Editable Text: Step-by-Step
Why Converting Infographics to Text Matters
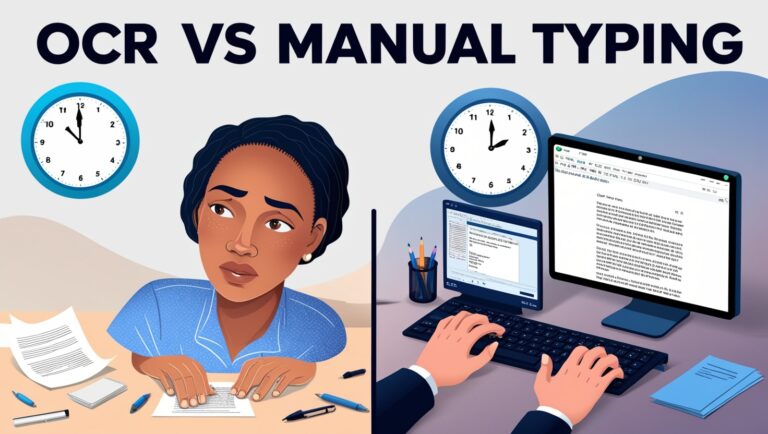
As a professional manager, I’ve worked with many reports and visual data. Infographics are great for quick views, but sometimes I need the exact words for editing or research. That’s when image to text tools become important. These tools, powered by Optical Character Recognition (OCR), help convert infographic images into editable, searchable text.
Many students, researchers, and teams waste time copying by hand. But with the right method, you can convert infographics in just a few clicks. This article will explain the step-by-step process, tools to use, and tips I’ve learned from years of experience.
Step 1: Choose a Clear Infographic Image
Make sure your infographic is clear and not blurry. OCR works best when text is easy to read. If you take a screenshot or download an image, check that the font is not too small, colors don’t overlap, and there’s enough spacing between letters. Websites like Canva and Piktochart often offer high-quality infographics if you’re creating your own.
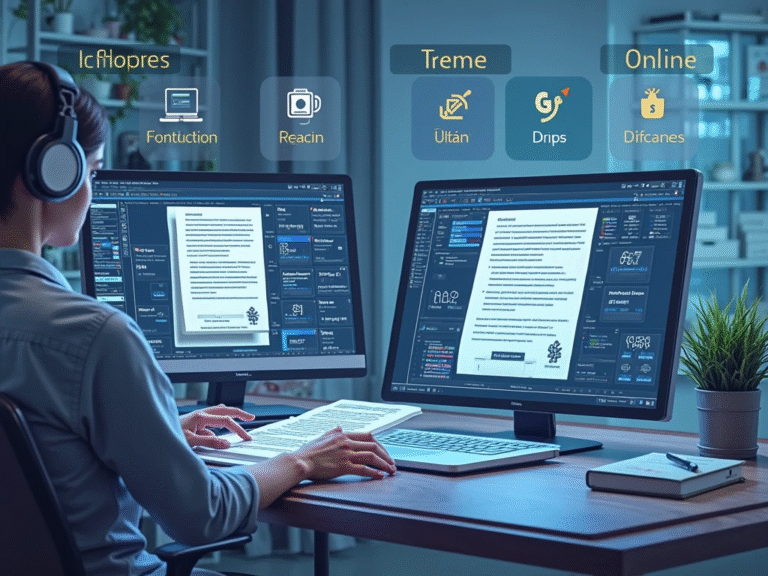
Step 2: Pick the Right OCR Tool
Next, choose a trusted OCR tool. There are many free and paid options. I recommend the following based on my personal use:
- Google Drive OCR: Upload your image and open it in Google Docs. It will extract the text.
- Adobe Acrobat OCR: Best for PDFs with infographic-style layouts.
- OnlineOCR.net: Simple, fast, and supports many languages.
- Tesseract OCR: Open-source and great for developers or teams working on custom tools.
Step 3: Upload and Convert the Infographic
Once you’ve selected a tool, upload your image. Make sure to choose the right language and output format (like .txt, .docx, or .xlsx). Many tools allow batch processing if you have several images. This step usually takes just a few seconds to complete. The result will be editable text that you can copy and paste into your document.
Step 4: Clean Up the Extracted Text
OCR is not perfect. You may find extra spaces, misread characters (like “I” vs “1”), or missing parts if the image was blurry. I always double-check the output. Use a spell-checker or grammar tool like Grammarly to fix errors quickly.
Step 5: Keep the Format Intact
If your infographic has headings, tables, or bullet points, try using OCR tools that support layout detection. Tools like Adobe Acrobat or ABBYY FineReader do this well. Some allow you to preserve formatting, which is useful if you’re turning the infographic into a report or blog post.
Step 6: Store and Share Text Safely
Once the text is ready, save it in a safe location. I use cloud storage like Google Drive or Dropbox. If your text includes private or company data, be sure to encrypt it or use secure sharing settings. Learn more about secure file storage from Cybersecurity & Infrastructure Security Agency (CISA).
When OCR May Struggle: Dealing with Low-Quality Infographics
Sometimes, even good OCR tools can’t handle low-quality infographics. Here’s a table showing common problems and their solutions:
| Problem | Solution |
| Blurry image | Use photo editing tools to sharpen the image |
| Handwritten fonts | Choose tools that support handwriting OCR |
| Mixed languages | Pick OCR tools that support multilingual text |
| Curved or rotated text | Use image correction before OCR |
| Complex design layouts | Manually copy or retype special sections |
Personal Example: Saving Time in Weekly Reports
At my workplace, we often get marketing updates in infographic format. Earlier, my team used to manually type out key points to insert into monthly summaries. That changed once we started using Google Drive OCR. Now, we just upload the infographic, convert it to Google Docs, and copy the text we need. This switch cut our prep time by more than half!
Next, I’ll explain how to automate this workflow, improve accuracy using AI-based OCR, and how teams with visually impaired members can benefit from this process.
How Image to Text Conversion Helps Team Members with Visual Disabilities
Not everyone can easily read colorful or complex infographics. Some of my coworkers live with visual impairments. Before we used OCR tools, they had to rely on someone else to read the infographic out loud or explain it.
Now, by converting infographics into text, these team members can use screen readers like NVDA or JAWS to hear the content. The text format works with their accessibility tools and helps them stay independent and productive. In fact, many accessibility experts recommend providing text alternatives for visual content. The World Wide Web Consortium (W3C) explains how this supports equal access online.
Using AI-Based OCR to Improve Accuracy
Some modern OCR tools now use Artificial Intelligence (AI) to understand not only the text but also the layout and context of the infographic. AI-powered platforms like Microsoft Azure OCR and Google Cloud Vision are better at reading messy, noisy, or colorful designs.
In my company, we tested Google Vision to process infographics from social media reports. These designs often had logos, multiple fonts, and bright colors. The AI OCR recognized these styles better than traditional tools and delivered cleaner, more accurate text.
Best Practices to Follow When Turning Infographics into Editable Text
After using many OCR tools in my role, here are some quick tips I share with my staff to get the best results:
1. Use high-resolution images
A clear image reduces OCR mistakes. Avoid screenshots from low-quality sources.
2. Keep files organized
Name your files by date or topic, like “SalesReport_June2025.jpg” for quick searching later.
3. Choose the right format
If you’re making reports, save output as .docx. For data tables, .xlsx is better.
4. Always proofread
OCR isn’t perfect. Review the converted text before using it in presentations or sharing with clients.
5. Combine OCR with translation if needed
Some tools can translate while converting. This is helpful for international teams. Tools like i2OCR support multiple languages.
A Simple Workflow for Busy Professionals
To help others who work in fast-paced environments like me, here’s a simple 4-step daily routine we follow when working with infographics:
| Task | Tool Used | Time Taken | Goal Achieved |
| Save infographic from email | Screenshot or Save Image | 1 minute | Image ready for upload |
| Upload to OCR tool | Google Drive OCR | 2 minutes | Text extracted from infographic |
| Clean and format text | Grammarly + Word | 3–5 minutes | Spelling and format adjusted |
| Store in shared folder | Dropbox or Google Drive | 1 minute | Team can access and edit anytime |
This process saves me 10–15 minutes per image and allows everyone on the team—regardless of ability—to access the same content quickly.
Final Thoughts: Why You Should Start Using OCR Today
Infographics are everywhere—from marketing and education to healthcare and finance. But if the information is locked inside an image, it becomes hard to reuse, analyze, or share—especially for people with limited vision or time. With the help of free or premium OCR tools, anyone can turn these static visuals into live, editable, searchable content.
As someone who manages both creative teams and data teams, I can say this change has helped us move faster, include more people, and reuse valuable insights in new ways.
You don’t need to be a tech expert to start. Just try one of the tools mentioned above, pick a good image, and follow the steps. In just minutes, your team will have access to the hidden power inside your infographics.